AWS RedShift Vs SQL Server – War Verdict

Are you keen on moving your BI setup from on-premise to the cloud? Are you wondering whether moving to AWS Redshift is worth the effort? Find answers to these and more – the post you’ve been waiting for is here! We pitted SQL Server against a giant contender, the AWS Redshift, in a typical BI Setup.
You must be living under a rock if you haven’t already foreseen that Redshift won this battle. What amazes us, is the measure by which Redshift won. For those of you who need a heads up on the prowess of Redshift, read AWS Redshift – 5 reasons to make the shift!
SETTING UP
- On-premise
- BI – WebFOCUS
- DB – SQL Server
- Data – 10 million records
- Cloud
- BI – WebFOCUS Cloud
- DB – AWS Redshift Data Warehouse
- Data – 10 million records
- Dashboard
- A typical Sales Dashboard by different Regions, Products, Vendors and by Location
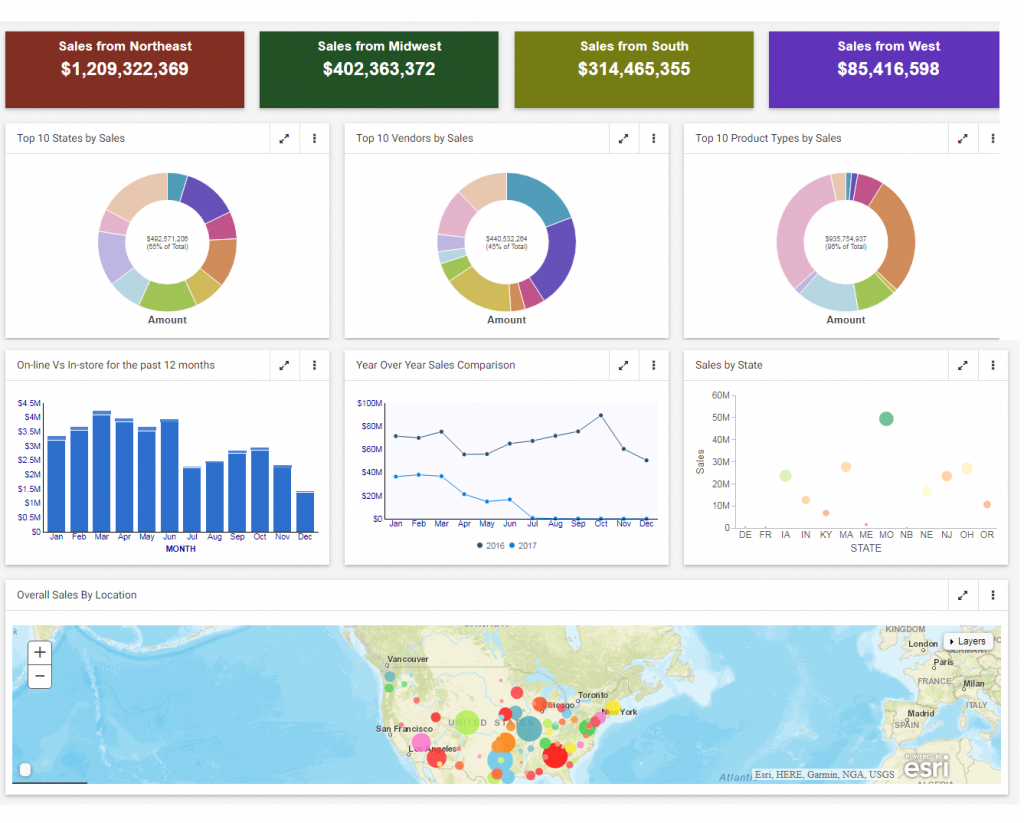
The dashboard is a healthy mix of charts and KPIs and we’ve closely based it on an actual firm’s data – 4 KPIs, 6 charts and a Map to be precise.
REDSHIFT SETUP GUIDELINES
Our Redshift setup was designed around 3 basics:
1. Sort Key – When you create a table, you can specify one or more columns as the sort key. Amazon Redshift stores your data on disk in sorted order according to the sort key.
2. Distribution Styles – Distribution Style is a table property which dictates how that table’s data is distributed throughout the cluster.
KEY distribution – The rows are distributed according to the values in one column. The leader node will attempt to place matching values on the same node slice.
EVEN distribution – The rows are distributed across the slices in a round-robin fashion, regardless of the values in any column.
ALL distribution – A copy of the entire table is distributed to every node.
3. Compression Encodings – Compression is a column-level operation that reduces the size of data when it is stored. Compression conserves storage space and reduces the size of data that is read from storage, which reduces the amount of disk I/O and therefore improves query performance.
Pro tip – migrating 10 million records to AWS Redshift is not for novices. To know how we did it in minutes instead of days – click here!
SQL SERVER VS REDSHIFT – THE VERDICT
Here are the actual results from our test lab. You can clearly see how Redshift lives up to the promise of 10x faster querying speeds!
STATS
Not 1 lap, not 2 laps, but Redshift won by a good 10 laps!
| Environment Setup | ||
| On Premise – WebFOCUS and SQL Server | In Cloud – WebFOCUS and Redshift | |
| Chart Name | Process Time in Secs | Process Time in Secs |
| Sales from Northeast | 06.343 | 00.127 |
| Sales from Midwest | 06.525 | 00.570 |
| Sales from South | 04.077 | 00.209 |
| Sales from West | 02.927 | 00.155 |
| Top 10 States by Sales | 13.595 | 01.473 |
| Top 10 Vendors by Sales | 32.631 | 03.010 |
| Top 10 Product Types by Sales | 15.148 | 02.476 |
| On-line Vs In-store for the past 12 months | 48.683 | 03.940 |
| Year Over Year Sales Comparison | 09.971 | 00.326 |
| Sales by States | 06.204 | 00.568 |
| Overall Sales by Location | 22.689 | 03.679 |
| Total Time to load dashboard | 50 | 6 |

COMPRESSION RESULTS
| Redshift with Data Compressed | Redshift without Data Compressed | |
| Chart Name | Process Time in Secs | Process Time in Secs |
| Sales from Northeast | 00.127 | 00.127 |
| Sales from Midwest | 00.570 | 00.570 |
| Sales from South | 00.144 | 00.209 |
| Sales from West | 00.155 | 00.155 |
| Top 10 States by Sales | 02.751 | 01.473 |
| Top 10 Vendors by Sales | 04.663 | 03.010 |
| Top 10 Product Types by Sales | 03.664 | 02.476 |
| On-line Vs In-store for the past 12 months | 05.820 | 03.940 |
| Year Over Year Sales Comparison | 00.180 | 00.326 |
| Sales by States | 00.216 | 00.568 |
| Overall Sales by Location | 05.933 | 03.679 |
| Total Time to load dashboard | 9 | 6 |
| Number of Rows in Table | Data Compressed | Size in GB |
| 10,284,522 | Y | 1.1 GB |
| 10,284,522 | N | 3.5 GB |
While the query time increases when data is compressed, Redshift’s compression saves about 60% disk space, which is impressive.
MIGRATE THE AMTEX WAY
How wonderful would it be, if migrating to Redshift was as easy as seating your data in the Ferrari of data warehousing? Well we’re holding the door open for you. We ditch the traditional ETL paradigm when it comes to loading up data into Redshift – ELT helps us monetize on the MPP architecture of Redshift.
Allow Amtex BI to put you on the fast lane of cloud migration.
- AWS
- Cloud BI
- Cloud Data Warehouse
- Cloud Migration Services
- Migrate
- Move Data
- Redshift
- Redshift Benchmarks
- SQL Server Vs Redshift
- Statistics